- Population (2012): 29,179,952
- Density (people per square km): 87.84 (2011)t
- Net Migration Rate (# per 1,000 people): -0.37 migrant(s)/1,000 population
- Birth Rate (# per 1,000 people): 20.74 births/1,000 population (July 2012)
- Death Rate (# per 1,000 people) 4.95 deaths/1,000 population (July 2012)
- Population Growth Rate: 1.542% (2012 est.)
- Infant Mortality Rate (# of deaths per 1,000 live births): 14.57 deaths/1,000 live births
- Total Fertility Rate (average # of children per women): 2.64 children born/woman (2012 est.)
- % of Population Age <14: 29.4%
- % of Population Age +65: 5.1%
- Life Expectancy at Birth (total): 74.04 years
- GNU PPP per capita in U.S Dollars: $17,675
- Population Living Below $2 per day: 3.8% (2009 est.)
- Mobile phone subscribers (# per 100): 41.9 million (2013)
- Motor Vehicles (# per 1,000): 361/1,000
- Undernourished population: 5.01
- Underweight Children Under Age 5: 22.1
- HIV/AIDS among people ages 15- 49: 2,692 per year (2008)
- Population Pyramid For Malaysia [1995]: <http://populationpyramid.net/Malaysia/1995/>
- Population Pyramid For Malaysia [2010]: <http://populationpyramid.net/Malaysia/2015/>
- Population Pyramid For Malaysia [2025]: <http://populationpyramid.net/Malaysia/2030/>
- Population Pyramid For Malaysia [2050]: <http://populationpyramid.net/Malaysia/2050/>
- The historical trend I find through the years 1950-1990 is that it went from a lot of kids to slowly but surely getting smaller, whereas the number of adults stayed the same.
- I hypothesize that the reason for the historical population pyramid shapes from 1950-1990 are a large number of kids but a slowly declining rate but the same average of adults is because the country is the most dominant group in asian culture with regards to politics, rendering it wealthy and therefore healthy. It also exports lots of good such as palm oil, computer disk drives, rubber and timber.
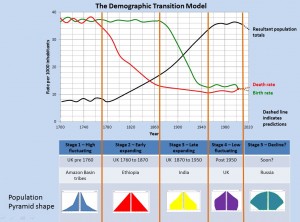
- I believe that Malaysia is in stage three because they are starting to have a lowered population rate and the dea